Introduction
Machine learning is a modern task in data science that uses observed data
values to model and predict data. It takes advantage of having observed data
available, but what should be done when observed data cannot be obtained? A
common practice is to use predicted values when observed values are
unavailable, but without any corrections we inevitably run into issues such
as deflated standard errors, bias, and inflated false positive rates.
Wang et al. proposes a method to correct inference done on predicted
outcomes-which they name post-prediction inference, or postpi-in Methods for
correcting inference based on outcomes predicted by machine learning. This
statistical technique takes advantage of the standard structure for machine
learning and uses bootstrapping to correct statistical error using predicted
values in place of observed values.
We are exploring the applicability of Wang et al.'s postpi bootstrapping
technique on political data-that is, on political twitter posts. Our project
will be investigating what kinds of phrases or words in a tweet will strongly
indicate a person's political alignment, in the context of US politics. By
doing so, we can simultaneously test how the bootstrap post-prediction
inference approach interacts with Natural Language Processing models and how
this method can be generally applicable towards analyses in political science.
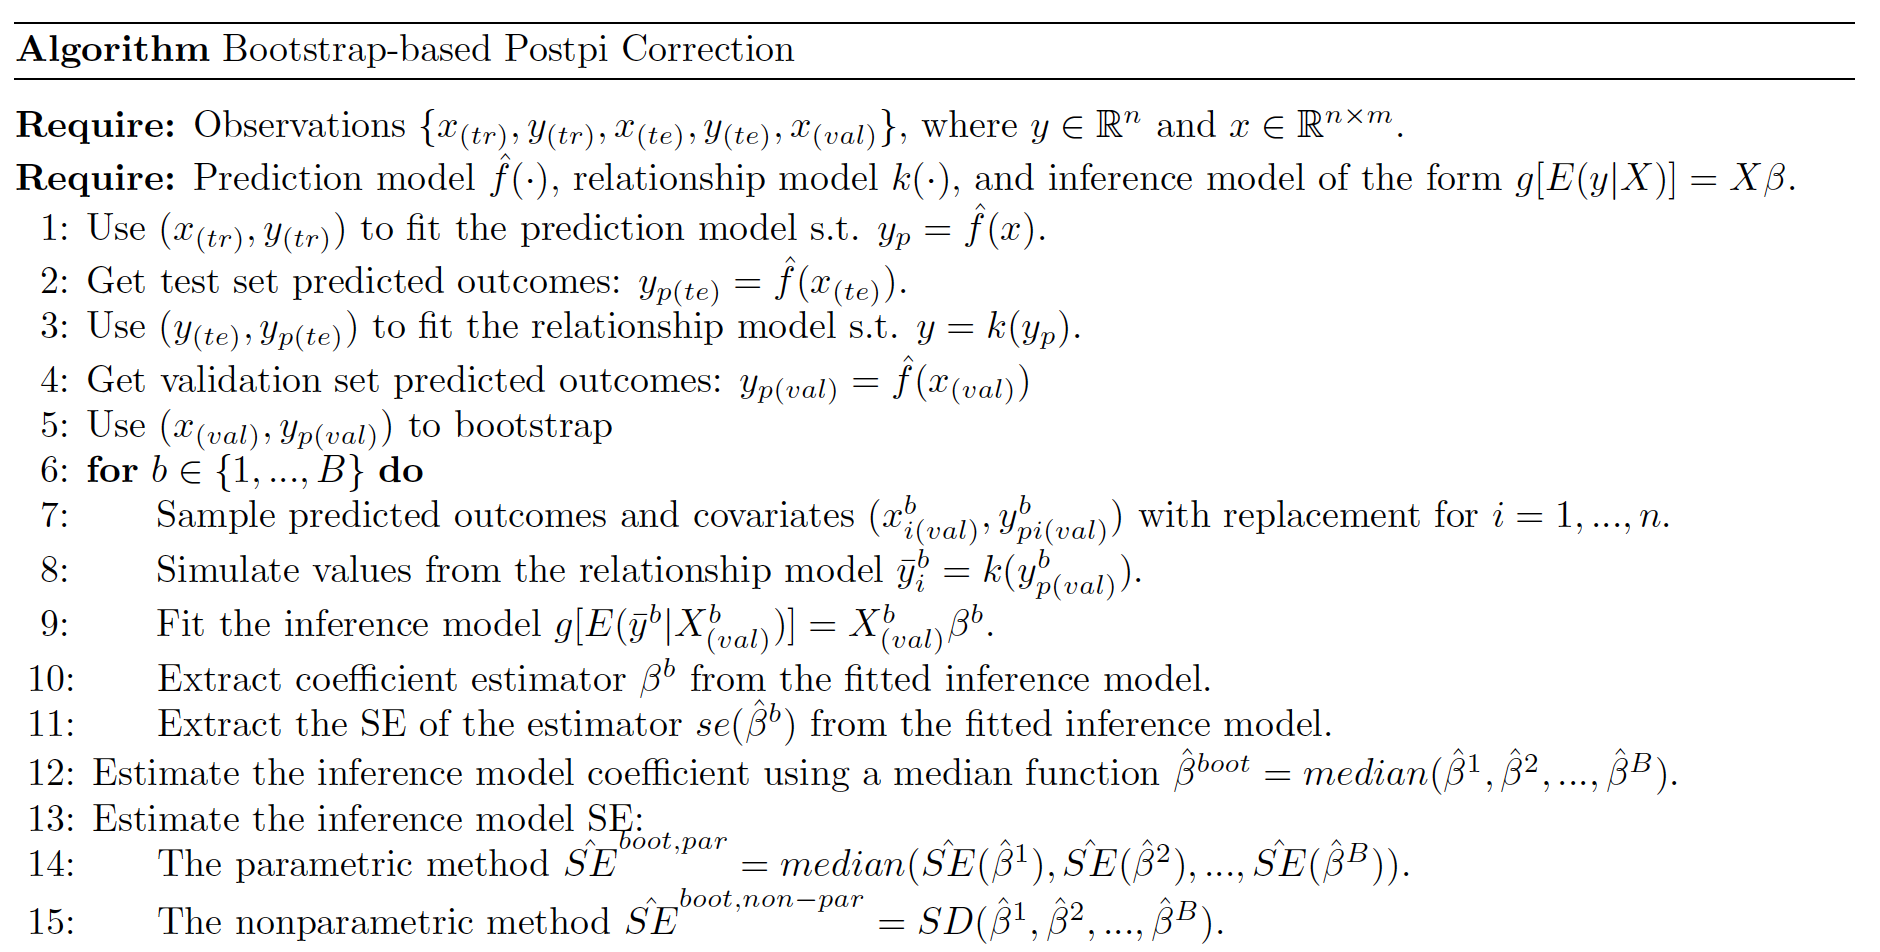
Methodology
The postpi bootstrap approach by Wang et al. is a method that aims to correct inference in studies that use predicted outcomes in lieu of observed outcomes. It is effective due to its simplicity-this approach is not dependent on deriving the first principles of the prediction model, so we are free to focus on accuracy without worrying about the impact of the complexity of the model on the bootstrap approach. The reason why it is not dependent is because this approach utilizes an easily generalizable and low-dimensional relationship between observed and predicted outcomes.
The postpi bootstrap approach relies on four assumptions about our data:
- There must be a training and testing dataset with observed outcomes to train the prediction and relationship model.
- Observed and predicted outcomes should have a simple, low-dimensional relationship.
- The relationship model that describes the relationship between observed and predicted outcomes should be consistent for future data.
- The features used for inference should be present within the training and testing data, and used in the prediction model.
An implementation of this algorithm is provided below:
Data
Data Collection and Cleaning
We collected our data by scraping tweets from US politicians from Twitter.
Specifically, we took the Twitter handles of the President, Vice President, and all
the members of US Congress except Representatives Chris Smith (R-NJ) and Jefferson
Van Drew (R-NJ), as they have both deleted their Twitter accounts. These Twitter
handles were compiled and provided by the
UCSD library, and
outdated names or Twitter handles were updated manually by ourselves. Additionally,
the two Independent members of Congress-Senators Bernie Sanders (I-VT) and Angus King
(I-ME)-will be considered Democratic politicians for our purposes, as they caucus with
Democrats.
To prepare our data for prediction and feature selection, we cleaned the tweets by
expanding all contractions, converted all text into lowercase format, and removed urls,
punctuation, and unicode characters. Additionally, we also removed stopwords like
‘the’, ‘an’, ‘are’, etc. using the dictionary of stopwords provided by the NLTK package.
Exploratory Data Analysis
Our data consists of a relatively equal number of tweets leaning either Democratic or Republican. As said earlier, with Independent politicians counting as Democrats, the table below is a brief overview of our data.
| Democrats | 22,850 |
| Republicans | 21,478 |
| Total | 44,328 |
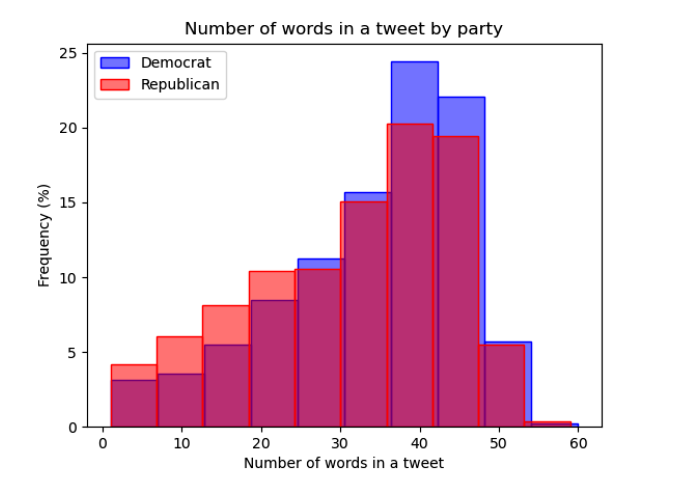
Taking a deeper dive into the data, we look at the distribution of tweet lengths for
either party. Figure 1 is an overlaid histogram plotting the number of words in tweets
from Democrats and Republicans. While both histograms are clearly skewed to the left, we
can see that the distribution of the length of tweets for Democrats has a higher peak than
the distribution for Republicans. This tells us that tweets from Democrats average more
words compared to their counterparts on the opposite aisle.
This could imply that the prediction model will utilize more vocabulary from
Democrat-classified tweets than Republican, which might have interesting effects on the
prediction model and thus the bootstrap algorithm and inference.
We take a deeper dive into each party in Figure 2 below, which lists the 10 most frequent
words used by Democrats and Republicans, excluding stopwords. There are very few
commonalities between either party–only two words are commonly used by both parties:
‘today’ and ‘year’.
Democrats seem to focus on policy issues as suggested by ‘act’ and ‘infrastructure’, but
otherwise their attentions are spread across a multitude of topics as no single unifying
issue seems to be able to group together their most frequently used words. On the other
hand, Republicans seem to focus more on their political opponents–words such as ‘biden’,
‘democrats’, and ‘president’ seem to suggest that–and on the American people. There is
notably a significant reference to ‘biden’, with the President’s name being used
approximately 3500 times, almost double the frequency of the second most popular word.
As such, Figure 2 shows us that Republican-classified tweets may revolve more strongly
around certain themes, such as their opponents, compared to Democrat-classified tweets.
Again, this may influence the prediction model and in turn the inference conducted on our
features.

Methods
Prediction and Relationship Model
During this stage of our project, we worked on maximizing the accuracy of our prediction
model. We compared several different prediction models in the process of coming up with
our final model, trying other classification algorithms such as logistic regression and
ridge regression (regularized).
In the end, we used a TF-IDF vectorization model with 200,000 features and 1-3 words per
feature, and an SVC model for prediction, with a linear kernel and C=1.5. For the
relationship model that takes in the predicted and observed outcomes, we used a K-NN model.
Feature Selectiom for Inference
We reviewed relevant literature in political science to develop a criteria for choosing our
features.
In Twitter Language Use Reflects Psychological Differences between Democrats and Republicans,
Sylwester and Pulver discuss the differences between Democrats and Republicans in the context
of previous findings and their own discoveries. For example, Haidt’s Moral Foundations model,
which identifies “harm, fairness, liberty, ingroup, authority, and purity” as the pillars of
morality, has been used to distinguish between liberals and conservatives. It was found that
liberals prioritized the harm and fairness aspects of morality, while conservatives focused more
on liberty, ingroup, authority, and purity. Sylwester and Pulver also found differences between
Democratic and Republican-aligned people when it came to what kinds of topics they discussed and
emotions they expressed–Republicans focused more on topics such as “religion…, national
identity…, government and law…, and their opponents” while Democrats were focused on emphasizing
their uniqueness and generally expressed more anxiety and emotion.
These findings are somewhat in line with our own observations made through the data–as stated
before, we found that Republican tweets made references to their opponents on a much larger scale
than Democrats, and also made mention of the American people–their national identity–plenty of
times as well.
We also reviewed Chen et al.’s study, #Election2020: the first public Twitter dataset on the 2020
US Presidential election. Chen et al. found that more conservative Twitter users tended to share
more topics related to conspiracy theories and “public health and voting misinformation” compared
to liberal Twitter users.
Taking these two sources into consideration, our criteria for selecting features was whether or
not they would fall into either liberal or conservative tendencies as discovered by either source.
We ended up selecting 5 features to conduct inference, which are:
| border | illegal | god | defund | happy |
We hypothesized that the first three would be strong indicators for a Republican-classified tweet as they allude to national identity and religion, while the last two would indicate a Democratic-classified tweet as they allude to concepts of harm and fairness, as well as emotion.
Results
After conducting inference using the bootstrap postpi algorithm, we found that the parametric bootstrap method worked best to correct for inference. As such, for the inference we interpret below we will only be considering the corrections made using the parametric method, and not the non-parametric bootstrap method.
Inference on "border"
| Feature: border | Actual Values | No Correction | Non-Parametrix | Parametric |
| Coefficient | 7.49 | 8.27 | 7.50 | 7.50 |
| SE | 0.85 | 0.87 | 0.39 | 0.84 |
| T-Stat | 8.84 | 9.56 | 19.28 | 8.97 |
The table shows the results of conducting inference on the word "border". The bootstrap postpi algorithm corrects coefficients, SEs, and t-statistics as mentioned above and the results below shows that the algorithm works as intended.
- The true beta coefficient has a value of 7.491, but in the case that we didn't have the observed values, using the bootstrap postpi algorithm would correct the coefficient to 7.498. The corrected value is a better estimate for the coefficient compared to the no correction approach value of 8.272. The coefficient was corrected by an absolute difference of 0.007.
- The SE for a no correction approach results in an absolute difference of 0.018 to the true value, but after correction, the absolute difference decreases to 0.011.
- The t-statistic for the no correction approach results in an absolute difference of 0.72 while the corrected approach resulted in an absolute difference of 0.125.
These results are meaningful because the smaller differences would suggest that we have a good bootstrap model that corrects inference using predicted values instead of observed values.
A positive coefficient for the word "border" implies that this feature is a good predictor for the Republican party. To test whether the feature is a statistically significant predictor we must evaluate the t-statistic. If the null hypothesis was true-that there is no significant difference between Republicans and Democrats in their use of the word "border"—then we would expect a sample with no difference. Since the corrected t-statistic of ~ 8.966 is greater than 2, we have 95% confidence that there is a positive difference between our sample data and the null hypothesis. This implies that the word "border" is a good predictor for the Republican party.
Inference on "illegal"
| Feature: illegal | Actual Values | No Correction | Non-Parametrix | Parametric |
| Coefficient | 5.79 | 6.39 | 5.83 | 5.83 |
| SE | 1.10 | 1.10 | 0.37 | 1.09 |
| T-Stat | 5.28 | 5.81 | 15.81 | 5.34 |
The table shows the results of conducting inference on the word "illegal".
- The true beta coefficient has a value of 5.790, but in the case that we did not have the observed values, using the bootstrap postpi algorithm would correct the coefficient to 5.832. The corrected value is a better estimate for the coefficient compared to the no correction approach value of 6.392.
- The SE for the no correction approach results in an absolute difference of 0.004 but after running the bootstrap postpi algorithm, the absolute difference decreased to 0.003.
- The t-statistic for a no correction approach results in an absolute difference of 0.529 while the corrected absolute difference resulted in 0.051.
These results are meaningful because the smaller differences would suggest that we have a good bootstrap model that corrects inference using predicted values instead of observed values.
A positive coefficient for the word "illegal" implies that this feature is a good predictor for the Republican party. Since the corrected t-statistic of ~ 5.335 is greater than 2, we have 95% confidence that this feature is a statistically significant predictor.
Inference on "god"
| Feature: god | Actual Values | No Correction | Non-Parametrix | Parametric |
| Coefficient | 4.90 | 5.45 | 4.78 | 4.78 |
| SE | 1.03 | 1.04 | 0.37 | 1.01 |
| T-Stat | 4.76 | 5.25 | 12.79 | 4.72 |
The table shows the results of conducting inference on the word "god".
- The true beta coefficient has a value of 4.90, but in the case that we didn't have the observed values, using the bootstrap postpi algorithm corrects the coefficient to 4.78. The corrected value is a better estimate for the coefficient compared to the no correction approach value of 5.45. The coefficient was corrected by an absolute difference of 0.55.
- The SE for a no correction approach results in an absolute difference of 0.007 to the true value, but after correction, the absolute difference increased to 0.018.
- The t-statistic for the no correction approach results in an absolute difference of 0.493 while the corrected approach resulted in an absolute difference of 0.036.
These results are meaningful because the smaller differences would suggest that we have a good bootstrap model that corrects inference using predicted values instead of observed values.
A positive coefficient for the word "god" implies that this feature is a good predictor for the Republican party. To test whether the feature is a statistically significant predictor we must evaluate the t-statistic. Since the corrected t-statistic of ~ 4.720 is greater than 2, we have 95% confidence that this feature is a statistically significant predictor.
Inference on "defund"
| Feature: defund | Actual Values | No Correction | Non-Parametrix | Parametric |
| Coefficient | 1.18 | 1.51 | 1.08 | 1.08 |
| SE | 1.92 | 1.92 | 0.39 | 1.92 |
| T-Stat | 0.62 | 0.79 | 2.75 | 0.56 |
The table shows the results of conducting inference on the word "defund".
- The true beta coefficient has a value of 1.181, but in the case that we didn't have the observed values, using the bootstrap postpi algorithm would correct the coefficient to 1.076. The corrected value is a better estimate for the coefficient compared to the no correction approach value of 1.511. The coefficient was corrected by an absolute difference of 0.105.
- The SE for a no correction approach results in an absolute difference of 0.002 but after running the bootstrap postpi algorithm, the absolute difference decreased to 0.0001.
- The T-Statistic for a no correction approach results in an absolute difference of 0.173 while the corrected absolute difference resulted in 0.055. These results are meaningful because the smaller differences would suggest that we have a good bootstrap model that corrects inference using predicted values instead of observed values.
Interestingly, conducting inference on the feature "defund" yielded a positive coefficient, which implies that this feature is a good predictor for the Republican party, and not the Democratic party contrary to our hypothesis.
To test whether the feature is a statistically significant predictor we must evaluate the t-statistic. Since the corrected T-Statistic of ~ 0.560 is less than 2 and greater than -2, we have 95% confidence that there is not a positive difference between our sample data and the null hypothesis.
Inference on "happy"
| Feature: happy | Actual Values | No Correction | Non-Parametrix | Parametric |
| Coefficient | 0.93 | 1.14 | 0.96 | 0.96 |
| SE | 0.50 | 0.50 | 0.43 | 0.50 |
| T-Stat | 1.89 | 2.29 | 2.21 | 1.92 |
The table shows the results of conducting inference on the word "happy".
- The true beta coefficient has a value of 0.935, but in the case that we didn't have the observed values, using the bootstrap postpi algorithm would correct the coefficient to 0.959. The corrected value is a better estimate for the coefficient compared to the no correction approach value of 1.137.
- The SE for a no correction approach results in an absolute difference of 0.001 but after running the bootstrap postpi algorithm, the absolute difference increased to 0.0045.
- The t-statistic for a no correction approach results in an absolute difference of 0.406 while the corrected absolute difference resulted in 0.0321.
These results are meaningful because the smaller differences would suggest that we have a good bootstrap model that corrects inference using predicted values instead of observed values.
Once again, we find that inference on the feature "happy" also yielded a positive coefficient, which tells us that this feature is a good predictor for the Republican party, and not the Democratic party. This is, again, contrary to what we hypothesized would be the case.
To test whether the feature is a statistically significant predictor we must evaluate the t-statistic. Since the corrected T-Statistic of ~ 1.920 is less than 2 and greater than -2, we have 95% confidence that there is no positive difference between our sample data and the null hypothesis.
Conclusion
In conclusion, we have demonstrated that the bootstrap postpi algorithm first developed by Wang et al. is shown to correct predicted outcomes when observed outcomes are not available on political data. In such a field where collecting observed outcomes can be exceedingly time-consuming and expensive to collect, this is a significant finding that may open doors to some studies that may otherwise be too difficult to conduct.
References
Chen, E., Deb, A. & Ferrara, E. #Election2020: the first public Twitter dataset on the 2020
US Presidential election. J Comput Soc Sc (2021). https://doi.org/10.1007/s42001-021-00117-9
Sylwester K, Purver M (2015) Twitter Language Use Reflects Psychological Differences between
Democrats and Republicans. PLOS ONE 10(9): e0137422. https://doi.org/10.1371/journal.pone.0137422
Wang, Siruo, Tyler H. McCormick, and Jeffrey T. Leek. "Methods for correcting inference based
on outcomes predicted by machine learning." Proceedings of the National Academy of Sciences
117.48 (2020): 30266-30275.